Evaluating Model Performance
Once you have fine-tuned a model, how do you know if it's any good? Evaluation metrics are quantitative measures used to assess the performance of a model on a given task. Choosing the right metric is just as important as choosing the right model architecture.
DNALLM's Benchmark and DNATrainer classes automatically calculate a suite of relevant metrics based on your task_type.
1. Metrics for Classification Tasks
Classification metrics are derived from the confusion matrix, which tabulates the number of correct and incorrect predictions for each class.
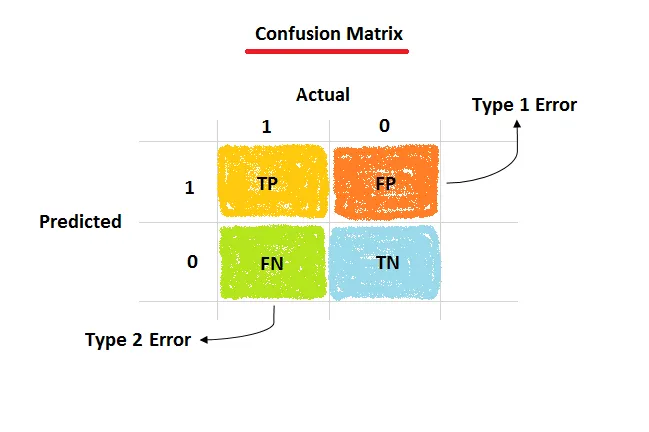 Image Credit: image by Amit Chauhan from Medium
- True Positives (TP): Correctly predicted positive samples.
- True Negatives (TN): Correctly predicted negative samples.
- False Positives (FP): Incorrectly predicted as positive (Type I Error).
- False Negatives (FN): Incorrectly predicted as negative (Type II Error).
Common Classification Metrics
-
Accuracy:
(TP + TN) / (TP + TN + FP + FN)- What it is: The overall percentage of correct predictions.
- When to use: Good for balanced datasets.
- Caveat: Can be very misleading on imbalanced datasets. A model that predicts "not a promoter" 99% of the time on a dataset with 1% promoters will have 99% accuracy but is useless.
-
Precision:
TP / (TP + FP)- What it is: Of all the samples the model predicted as positive, what fraction were actually positive?
- When to use: When the cost of a False Positive is high. (e.g., you want to be very sure that a predicted binding site is real before running an expensive experiment).
-
Recall (Sensitivity):
TP / (TP + FN)- What it is: Of all the actual positive samples, what fraction did the model correctly identify?
- When to use: When the cost of a False Negative is high. (e.g., in disease screening, you want to find all possible cases, even if it means some false alarms).
-
F1-Score:
2 * (Precision * Recall) / (Precision + Recall)- What it is: The harmonic mean of Precision and Recall.
- When to use: A great general-purpose metric for imbalanced datasets, as it requires a balance between Precision and Recall.
-
MCC (Matthews Correlation Coefficient): A correlation coefficient between the observed and predicted classifications. Ranges from -1 to +1.
- When to use: Considered one of the most robust metrics for imbalanced binary classification.
-
AUROC (Area Under the Receiver Operating Characteristic Curve):
- What it is: The ROC curve plots the True Positive Rate (Recall) against the False Positive Rate at various threshold settings. The area under this curve (AUC) represents the model's ability to distinguish between classes. An AUC of 1.0 is perfect; 0.5 is random.
- When to use: Excellent for evaluating a model's discriminative power across all possible thresholds.
-
AUPRC (Area Under the Precision-Recall Curve):
- What it is: Similar to AUROC, but plots Precision vs. Recall.
- When to use: More informative than AUROC for severely imbalanced datasets.
2. Metrics for Regression Tasks
Regression tasks involve predicting a continuous value.
- Mean Squared Error (MSE): The average of the squared differences between the predicted and actual values. Penalizes large errors heavily.
- Mean Absolute Error (MAE): The average of the absolute differences between the predicted and actual values. More robust to outliers than MSE.
- R-squared (R²): The proportion of the variance in the dependent variable that is predictable from the independent variable(s). A value of 1.0 means the model perfectly predicts the values.
3. Choosing the Right Metric in DNALLM
In your DNALLM configuration files (for training or benchmarking), you can specify which metrics to compute. The framework will automatically select the appropriate calculation based on the task_type.
Recommendation: For a new classification problem, always look at F1-Score, AUROC, and AUPRC, especially if your data might be imbalanced. Don't rely on accuracy alone.
Next: Learn how to make your training and inference faster and more efficient with Performance Optimization.